SOME NEW ANALYTICAL TECHNIQUES FOR USE IN CONSERVATIONMICHELE R. DERRICK, ERIC F. DOEHNE, ANDREW E. PARKER, & DUSAN C. STULIK
ABSTRACT—Standard analytical equipment found in modern laboratories can answer most questions asked about samples. New equipment designs or new approaches are sometimes needed, however, to answer very specific questions that arise. Examples of four techniques with potential applications and benefits to the field of art conservation are described. (1) Infrared mapping microspectroscopy is a method used to provide a “picture” of the location of components in a small sample, such as a paint cross section, based on an array of infrared spectra. (2) Environmental scanning electron microscopy (E-SEM) has the capabilities of a SEM but is especially designed to operate at near atmospheric pressures without conductive coatings on the samples. It can also be used to image dynamic processes in real time at high resolution. (3) Organic elemental analysis (OEA or CHNS-O) provides quantitative information on the amounts of carbon (C), hydrogen (H), nitrogen (N), sulfur (S), and oxygen (O) in a combustible material that can be used for the characterization of organic materials in a sample. (4) Photo-induced chemiluminescence (PICL) emissions produced from solid samples at room temperature can be measured by a new instrument and used to determine evidence of sample oxidative degradation long before the deterioration is manifested in any physically measurable quantity. 1 INTRODUCTIONThe dream machine in analytical chemistry is a black box into which a sample is placed and out comes a complete description that answers every possible question on the sample, its materials and their origin. But things are never so simple, and in reality, the more complex an analysis question is, the more sophisticated the analysis technique it requires. Fortunately, significant advances have been and are being made in the development of new instruments, techniques, and processing programs. Exploration of these new methods shows that many have the potential to answer some of the multifaceted questions posed in the field of art conservation. Of the many techniques available, this paper describes four new methods, along with applications for their use. 2 INFRARED MAPPING MICROSPECTROSCOPY (ORGANIC MICROPROBE)Compositional mapping of materials has been accomplished by a number of imaging technologies ranging from elemental imaging on an electron microscope to magnetic resonance imaging for medical diagnoses. Characterization of materials using infrared mapping microspectroscopy (also known as functional group mapping) has been developed for several years (Harthcock and Atkin 1988), and systems are now commercially available. Infrared mapping combines the analytical capabilities of an infrared microscope with a computer-controlled motorized stage and appropriate software programs to identify and locate various types of components, anomalies, and defects in materials. An infrared spectrum is a characteristic pattern of absorption bands that may be related to the various chemical functional groups of the material(s) being analyzed. Additionally in a multicomponent sample, the relative intensity of a functional group absorption band is For the applications presented here, area maps are obtained on embedded, polished paint cross sections. The sample is placed on the sample stage of the infrared microspectro-photometer (Spectra-Tech IRμS), and an analysis grid containing up to 600 points (e.g., 20 � 30) is selected (fig. 1) for the area of interest on the sample. An array of spectra is collected by reflection of the infrared radiation off the surface of the sample at each grid point (fig. 2). The effective resolution of the components in the sample is determined by the size of the analysis aperture and the density of the grid. The size of the aperture for these analyses was 20 � 40 μm (x, y axes, respectively). The selection of size was a trade-off between resolution and energy
From the array of spectra, contour maps are produced that provide information on the concentration and location of compounds in the sample (fig. 3). After an absorption band of interest is selected, such as a hydrocarbon band, its intensity is plotted versus its position in the grid where it was collected. The result is an area map of the intensities of that specific band plotted as a contour map where lines connect the areas of similar value. In these black-and-white plots, line thickness has been used to represent the changes in intensity of the absorption bands. The thickest lines correspond to the areas of strongest band intensity (i.e., highest concentration in the sample), and the thinnest lines represent the lowest intensities. The intensities are relative to each other, and the background intensity may not be zero depending on the baseline in the region.
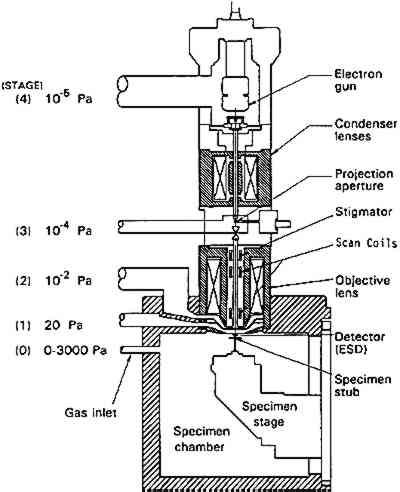
One example of infrared reflectance mapping is shown in figure 3 for a sample obtained from Dosso Dossi's Allegory of Fortune (ca. 1530–45) from the J. Paul Getty Museum. The photomicrograph of the paint cross section (fig. 3a) is marked to illustrate the area of the sample that was analyzed. Figure 3b, a plot for the carbonyl band at 1725 cm−1, shows that the highest concentration is due to the polyester embedding media surrounding the sample. The plot gives a general indication of the area analyzed. However, the area of the sample also has a consistent intensity level due to the adjacent carbonyl band for oil. Figure 3c is a plot of the carbonate band from the 1424 cm−1 region of the spectra. This plot indicates that the upper layer of the sample has the highest concentration of carbonates, corresponding to the azurite in that region. The remainder of the sample also contains lead carbonate and some calcium carbonate in the second layer from the bottom. Figure 3d is a plot of the sulfate or gypsum band in the region of 1152 cm−1. The highest concentration of this material is in the first (bottom) layer of the sample. Figure 3e is a plot of the hydrocarbon band at 2927 cm−1, corresponding to the dark green layer in the sample and probably attributable to the resin in copper resinate paint. In this particular sample, because extensive analyses had determined its components, the selected infrared absorption band and corresponding functional group can be related specifically to components in the sample. On other samples, it would be precarious to identify a material based on only one infrared absorption band. Infrared reflectance mapping shows potential for the determination of materials and their locations within a cross-section sample. The technique is complementary to elemental mapping using an electron microscope and may be done on the same sample. At this point, the method has two major limitations. The first limitation is the use of specular reflectance as an analysis method, which places a minimum size of 20 � 20 μm on the analysis window due to energy restrictions and can produce band distortions and shifts that it is difficult to compensate for. The second limitation is that a material cannot be reliably identified based on one infrared absorption band. Thus, additional analyses are required to supplement the map and provide interpretation. Future computer programs should allow a map to be created based on the selection of multiple absorption bands that can help identify specific compounds. 3 ENVIRONMENTAL SCANNING ELECTRON MICROSCOPE (E-SEM)Scanning election microscopy (SEM), with its high resolution, exceptional depth of focus, and compatibility with x-ray analytical techniques, has been used for a broad range of applications A sophisticated differential pumping system and a series of pressure-limiting apertures are used in the E-SEM microscope to create a pressure gradient between the sample chamber (900 Pa) and the electron gun compartment (10−5 Pa) (fig. 4). Thus the electron gun and beam column remain in high vacuum for good focusing and low beam diffusion, while the sample is near a pressure exerted by liquid water at ambient temperature. With this relatively high pressure in the sample compartment, wet or hydrated samples remain stable during examination, and most liquids may be observed.
The image is generated by a secondary electron detector developed specifically for this instrument. It works on the principle that secondary electrons emitted from the sample collide and ionize with neutral molecules in the air, creating a cascade effect, producing more electrons, thereby effectively multiplying the secondary electron signal. To maintain the high resolution of a SEM and minimize scattering of the primary electrons by gas molecules, the working distance between the sample and the final lens is kept as short as possible. Any surface charge generated on the sample by the primary electron beam is neutralized by a number of slow-moving positive ions that are formed with the interaction of the gas in the chamber and the secondary electrons emitted from the sample. The advantages of E-SEM technology simplify the methodology of current SEM experiments and open avenues for application that could previously not be explored due to difficulties in sample preparation. Several tests have examined potential use of E-SEM in art conservation (Doehne and Stulik 1990; Stulik and Doehne 1991; Doehne and Stulik 1991), and a few examples are presented below. Conventional SEM images are obtained by coating nonconductive samples with a thin gold or palladium layer to prevent charge buildup and arcing. However, this metal coating layer can interfere with the x-ray analysis of the
Dynamic studies allow the observation of microscopical changes of materials over time as various factors alter an object. Since processes often occur at rates both faster and slower than the human eye can register, the events are recorded on videotape for later transformation into an easily observable rate. Still images also can be produced at different points in the process for side-by-side comparisons. One test case was the examination of dissolution and crystallization processes. Using a heating and cooling stage, crystals of NaCl were observed at 20�C using water vapor as the imaging gas in the E-SEM sample chamber (fig. 7a, 7b). Upon cooling the stage to 9�C, at a constant pressure, water condensed on the surface of the salt, rapidly surrounding and dissolving the crystals into a droplet of salt solution (fig. 7c, 7d). The temperature was then raised back to 20�C, and the salt recrystallized as the water evaporated (fig. 7e, 7f). Further work has characterized the crystallization of additional types of salts, and future studies will examine the characteristics of salt crystallization in stone during thermal and wet-dry cycling. Other applications have shown the potential use of the E-SEM for dynamic studies of corrosion by air pollutants and the swelling and shrinking of adobe.
The E-SEM has several advantages over a conventional SEM that give it great potential for use in the field of conservation. The potential for dynamic examinations opens doors for several types of new studies, such as dynamic measurements of material deterioration mechanisms and conservation treatment failure modes. The disadvantages of the E-SEM compared to a SEM is that it has slightly lower resolution at high magnifications as well as limited working distance and low magnification capability. 4 ORGANIC ELEMENTAL ANALYSIS (OEA or CHNS-O)Organic elemental analysis (OEA or CHNS-O) provides quantitative information on the amounts of carbon (C), hydrogen (H), nitrogen (N), sulfur (S), and oxygen (O) in a combustible material. This information can be used for the characterization of organic materials in a sample. Organic elemental analysis is not a new technique, but recent advances in instrument design and sample size requirements have resulted in a re-examination of its potential for use in analysis of art materials. Modern elemental analyzers are now capable of working with samples of approximately 100 μg (depending on the carbon content of the sample). Organic elemental analyzers combust the sample, then separate, identify, and quantify the resultant gases (Pella 1990). A schematic of the instrument is shown in figure 8. It can be divided into two main sections: (1) combustion, and (2) separation. For analysis, a sample, encased in a tin cup, is dropped vertically into an oxygen-rich chamber and is combusted into its elemental oxides at temperatures in excess of 1700�C. The combustion gases (CO2, H2O, N2, and SO2) are then transferred to a gas chromatographic (GC) column for separation. The gases are detected and quantified with a thermal conductivity detector (TCD). Analysis for oxygen in the sample requires a slightly different instrument configuration, for which the internal atmosphere and GC column have been changed. The sample is pyrolyzed in an oxygen-free atmosphere, converting the oxygen in the sample to carbon monoxide (CO), after which it is separated and measured by GC-TCD.
Organic elemental analyzers can detect carbon in absolute concentrations as low as 0.5 μg, making OEA useful as a confirmation technique. In the OEA identification of proteinaceous binding media, the elemental composition varies with different types of binder as shown in figure 9, where %N is plotted vs. [In (C/N)]−1 for egg yolk, whole egg, egg white, and animal glues. The types of binder are readily differentiated using this method even though the sources of materials exhibited a wide range. The eggs were from chicken and ducks, and the glue samples were from rabbit skin, fish, bone, etc. The date of origin for the samples ranged from 1934 to the present. All types of single component binders, with or without noncombustible pigments,
Another application for OEA is as a screening method for carbon-14 analysis. In one case a sample was removed from a rock art drawing at the archaeological site of Santana do Riocho in the Brazilian state of Minas Gerais. OEA analysis of the sample was performed as an initial survey to determine whether the sample contained enough carbon for carbon-14 analysis. Results showed that carbon was present in the sample in low amounts and thus a large sample would be required for carbon-14 analysis. This result was significant because OEA provided this information on a small sample (140 μg) at approximately 1/50th the cost of carbon-14 analysis. The proportions of carbon, nitrogen, and hydrogen in the sample determined that an organic material was definitely present. However, because multiple materials may be present and because the In preparation for the restoration of the tomb of King Tutankhamen, some preliminary experiments have been done to develop methods for the analysis of binders in the presence of carbonates containing minerals. Table 1 shows the results of OEA on a standard mixture of gum arabic with calcium carbonate to determine the binder-to-pigment ratio. A warm water extraction method was used to remove the soluble components in the mixture prior to analysis. The results show that the extraction technique was successful. Thus there is a potential that OEA can be developed as a method for binder-pigment analysis. TABLE 1 BINDER-TO-PIGMENT RATIOS OF GUM ARABIC TO CALCIUM CARBONATE The main advantage of organic elemental analysis is that it is readily available at almost any commercial analysis laboratory at a reasonable cost (about $20 per sample). However, because it has rarely been used for samples from cultural objects, it is important that initial studies be conducted to understand the potential and limitations of the technique. One disadvantage is that the analysis is not specific for source components and that the results are a measure of the total amount of combustible material in the sample regardless of whether it is due to one component or many. 5 PHOTO-INDUCED CHEMILUMINESCENCE (PICL)Chemiluminescence is a process in which light is emitted from a material as a direct result of the decay of an excited state species formed from a chemical reaction. Because nearly all organic materials undergo some form of oxidative degradation that results in these faint chemiluminescent emissions, measurement of the light emission has been used to monitor deterioration in organic materials. A new instrument, which measures photo-induced chemiluminescence (PICL) emissions, is being used to investigate photo-oxidative processes occurring in materials used in the construction and conservation of cultural objects (Gromek and Derrick 1993). This sensitive instrument can measure minute changes in relative degrees of oxidation of a material at levels well below the detection limit of other techniques. Its precision makes chemiluminescence an ideal method for determining evidence of sample oxidative degradation long before the deterioration is manifested in any physically measurable quantity. This evidence can then be extended to the long-term aging effects or physical changes in the material (Mendenhall 1990). In this manner chemiluminescence can be used to predict the service life of a material under near ambient conditions (George et al. 1983).
Figure 10 is a cross-sectional view of the current configuration of the PICL chamber. Extremely mild photo-oxidation is induced through the irradiation of the sample with UV light from a small penray lamp. To prevent the source light from irradiating the photomultiplier detector, the experiment is done in a pulsed manner using one chopper (fig. 10, upper right) that can alternatively block either the source or the detector. Thus, when the sample is being
An ideal application for chemiluminescence investigation is photochemical reactions. Since it is the energy of the photons, not the number, that produces photochemical change, reactions still occur at low light levels (Feller 1964). Yet because other analytical techniques are not sensitive enough to measure changes due to low-intensity irradiance, it is sometimes assumed falsely that no reaction occurs. The effects of photographic flashes on photosensitive materials have previously been examined using multiple flash (25,000) exposures (Hanlan 1970). PICL, however, can detect changes in the oxidation states of silk and paper after exposure to a single flash. In this initial study, a sample of silk and a sample of paper were exposed to direct unfiltered light from a Sunpak 333D electronic flash. Prior to exposure an initial PICL measurement was taken. Then the sample was removed from the instrument, exposed to the flash, and placed back in the instrument for remeasurement. The flash was placed directly on the sample, and the flash duration was 1 millisecond. Table 2 presents the values for the total integrated chemiluminescent signals obtained for the samples after exposure to the indicated number of flashes. The value of the integrated signal is proportional to the amount of oxidizable species available on the surface of the sample. Thus the decrease in the measured values as the number of flashes increase indicates that the light from the flash has caused some oxidation of the sample, thereby depleting the level of oxidizable species available to produce the PICL signal. In addition to the flash measurements, a reproducibility study was done in which three PICL measurements were taken on another piece of silk over a similar TABLE 2 COMPARISONS OF PICL MEASUREMENTS FOR SILK AND PAPER EXPOSED TO AN ELECTRONIC PHOTOGRAPHIC FLASH Another area in which PICL measurements may be useful is the evaluation of real-time oxidation effects due to various illumination levels and energy distributions. As a preliminary study, four silk samples were placed under cutoff filters of 305, 345, 385, and 400 nm and exposed to a solar simulation source (Heraeus Sun Test Chamber, 30�C, approximately 100 lux) for short time periods (1 minute to 1 hour) to determine the effects of ultraviolet energy on sample oxidation. The results from the total integrated PICL emissions for each filtered exposure versus the total exposure time are plotted in figure 11. The results indicate that the greater the radiant energy exposure the silk sample receives, the more the sample is oxidized. As the wavelengths of UV energy are increasingly filtered out, the level of change is smaller. It is interesting to note, however, that some oxidation is still occurring when an ultraviolet exclusive cutoff filter of 400 nm is used. Significantly more oxidation occurs under the 385 nm filter, an illumination spectrum similar to conditions found in many museums.
PICL is a sensitive technique for measuring photo-oxidation under near ambient conditions. The low intensity light source provides, in practical terms, a nondestructive probe for the measurement of real-time oxidation. However, the instrument is still in the developmental stages, and much work remains to be done before a full understanding of the phenomenon of PICL is reached. 6 CONCLUSIONSThe methods described here have the potential for several important applications in the field of art conservation. While the organic elemental analyzers are readily available at most commercial analysis labs, the remaining techniques described have somewhat limited accessibility. At present, both the infrared mapping techniques and the environmental-SEM are commercially available, but there are fewer than 100 instruments of either type in use in North America. Most are located in university laboratories and research facilities. These numbers are growing steadily, and it is likely that both techniques will become REFERENCESBaker, M., D.vonEndt, W.Hopwood, and D.Erhardt. 1988. FTIR microspectrometry: A powerful conservation analysis tool. AIC preprints, 16th Annual Meeting, New Orleans. Washington, D.C.: AIC.1–13. Derrick, M. R., D. C.Stulik, J. M.Landry, and S. P.Bouffard. 1992. Furniture finish layer identification by infrared linear mapping microspectroscopy. Journal of the American Institute for Conservation31:225–36. Doehne, E., and D.Stulik. 1990. Applications of the environmental scanning electron microscope to conservation science. Scanning Microscopy4(2):275–86. Doehne, E., and D.Stulik. 1991. Dynamic studies of materials using the environmental scanning electron microscope. In Materials issues in art and archaeologyII, Materials Research Society Symposium Proceedings 185, ed.P.Vandiver, J.Druzik, and G. S.Wheeler. 31–37. Feller, R.1964. The deteriorating effect of light on museum objects. Museum News42(10):25. George, G. A., G. T.Egglestone, and S. ZRiddell. 1983. Chemiluminescence studies of the degradation and stabilization of polymers. Polymer Engineering and Science23(7):412. Gromek, J. M., and M. R.Derrick. 1993. Photo-induced chemiluminescence: A sensitive probe of oxidative changes in organic materials. Polymer Degradation and Stability39:261–68. Hanlan, J. F.1970. The effect of electronic photographic lamps on the materials of works of art. Museum News48(10):33. Harthcock, M. A., and S. C.Atkin. 1988. Infrared microspectroscopy: Development and applications of imaging capabilities. In Infrared Microspectroscopy, ed.R. G.Messerschmidt and M. A.Harthcock. New York: Marcel Dekker. 21–39. Katon, J. E., A. J.Sommer, and P. L.Lang. 1989. Infrared microspectroscopy. Applied Spectroscopy Reviews25(3):173. Mendenhall, G. D.1990. Chemiluminescence techniques for the characterization of materials. Angewandte Chemie: International Edition, English29(4):362. Pella, E.1990. Elemental organic analysis. Part 1, Historical developments. American Laboratory22(2):116–25. Stulik, D., and E.Doehne. 1991. Applications of environmental scanning electron microscopy in art conservation and archaeology. In Materials issues in art and archaeology, II, Materials Research Society Symposium Proceedings 185, ed.P.Vandiver, J.Druzik, and G. S.Wheeler. 23–29. Tsang, J., and R.Cunningham. 1991. Some improvements in the study of cross sections. Journal of the American Institute for Conservation30:163–177. AUTHOR INFORMATIONMICHELE R. DERRICK graduated from Oklahoma State University in 1979 with an M.S. in analytical chemistry. She joined the Scientific Program of the Getty Conservation Institute in 1983, where she is currently the acting head of the analytical section. Her research involves the development of new methods for the characterization and identification of organic materials in cultural objects, primarily using infrared spectroscopy and pyrolysis gas chromatography. Address: Getty Conservation Institute, 4503 Glencoe Ave., Marina del Rey, Calif. 90292. ERIC F. DOEHNE graduated from Haverford College with a B.S. degree in geology in 1984. He then completed his M.S. degree in geology at the University of California at Davis in 1987. He joined the Getty Conservation Institute in 1988, where he is currently an associate scientist in the architecture and monuments section. He obtained his Ph.D. in geology from the University of California at Davis in 1994, under the late Stanley V. Margolis. His current research is in the fields of stone conservation and archaeometry. Address: as for Derrick. ANDREW E. PARKER received a B.S. in biochemistry from California State University, Northridge, in 1990 and has been an intern at the Getty Conservation Institute since 1990. His research focuses on the identification of artists' materials using different analytical techniques and the development of novel sample preparation methods for the radiocarbon dating of cultural objects. Address: as for Derrick. DUSAN C. STULIK graduated from Charles University, Prague, Czechoslovakia, with B.S. and M.S. degrees in chemistry. He subsequently obtained a Ph.D. in physics from the Czechoslovakia Academy of Sciences. He is currently acting head of the scientific program at the Getty Conservation Institute. His current research is in the application of modern scientific methods in conservation science. Address: as for Derrick.
 Section Index Section Index |