IDENTIFICATION OF THE PRE-COLUMBIAN PIGMENT MAYA BLUE ON WORKS OF ART BY NONINVASIVE UV-VIS AND RAMAN SPECTROSCOPIC TECHNIQUESMARCO LEONA, FRANCESCA CASADIO, MAURO BACCI, & MARCELLO PICOLLO
3 RESULTS AND DISCUSSIONSpectroscopic investigation of samples of indigo, palygorskite, and Maya blue disclosed valuable information for their unambiguous differentiation and provided additional elements for further characterization of the pre-Columbian pigment. It is important to note that modern Maya blue and Maya blue from archaeological samples produced identical spectra with all techniques. The NIR is the only region in which no significant information concerning Maya
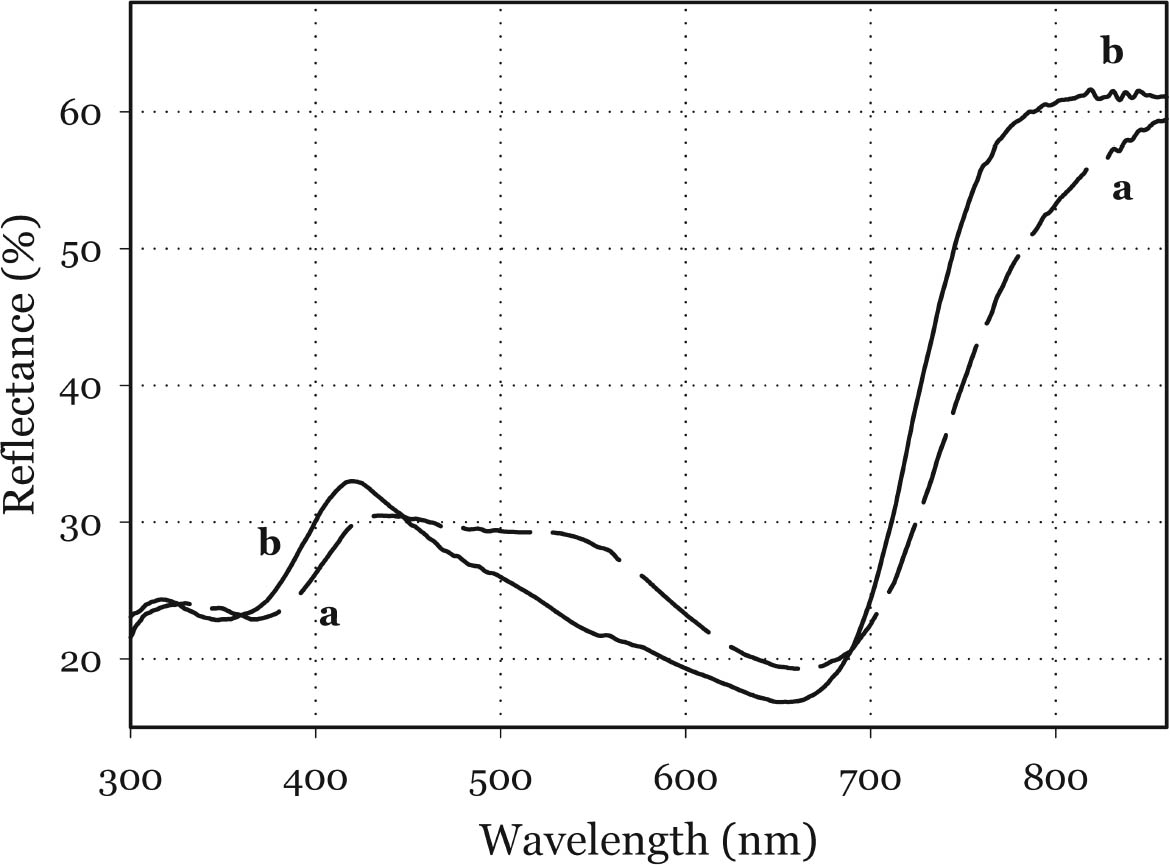
3.1 NIR REFLECTANCE SPECTROSCOPY AND UV-VISIBLE FIBER OPTICS REFLECTANCE SPECTROSCOPYNIR reflectance spectroscopy does not show any significant differences between Maya blue and palygorskite. In fact, the spectral features of palygorskite mask any other absorption peak, apart from a slight inflection at about 1700 nm, probably due to the first overtone of the C-H stretching (Bacci 2000). The visible spectra of indigo, as pure powder, mixed with an inert material (barium sulfate), or in a painted layer in actual works of art (Bacci et al. 1995; Aldrovandi et al. 1997; Miliani et al. 1998), differ substantially from those of indigo in Maya blue. As shown in figure 4, indigo is characterized by a broad and asymmetric band in the 420–730 nm range. The peak of the absorption band can be best appreciated when indigo is dispersed into an inert material: in such a case the peak is found at about 660 nm (indigo concentration below 9%). Indigo in Maya blue displays a narrower and more prominent band in the 540–730 nm range, the peak of which is slightly
Although the UV-Vis spectrum lacks the fingerprinting detail characteristic of vibrational molecular spectra (Raman and FTIR, discussed in the following paragraphs), the absorption maximum in the visible range and the actual curve profile allow differentiation of Maya blue from the pure indigo dye. The differences observed between the spectra of Maya blue and indigo arise from differences in the chemical environment for indigo molecules in the pure solid and adsorbed on palygorskite. The absorption band observed in the UV-visible spectrum at 420–730 nm corresponds to the lowest energy π-π* electronic transition, from the highest occupied molecular orbital (HOMO) to the lowest unoccupied molecular orbital (LUMO). This transition is strongly influenced by conditions such as aggregation state (vapor, amorphous solid, crystalline solid), solvation (more or less polar solvent may stabilize the ground state or the excited state of the molecule, leading to a shift in absorption wavelength), and pH. It is well known that indigo shows a strong solvatochromism (solvent-dependent color shift), confirming the strong influence that interand intramolecular bonding exert on the light-absorption properties of this molecule. In particular, it has been shown (Monahan and Kuder 1972; Serrano-Andr�s and Roos 1997) that in passing from vapor phase to nonpolar solvents and, successively, to polar solvents, the π-π* band is red-shifted; that is, the HOMO and LUMO levels move closer. It is likely that intramolecular H-bonds are favored in nonpolar solvents with a subsequent formation of indigo aggregates, whereas H-bonds with the solvent molecules are more probable in polar solvents. In the latter case there is a loosening of the N-H bond, which makes possible a withdrawal of electrons from the nitrogen atom and the carbon atoms of the O=C–C=C–C=O chain toward the hydrogen atom, thus resulting in a redistribution of electron charge. Pure indigo and indigo in Maya blue compare in a sense with indigo in nonpolar and polar solvents, respectively. In the former case, indigo-indigo interactions prevail due to the formation of intermolecular H-bonds, giving rise to aggregates of two or more indigo molecules. The palygorskite lattice can be compared to a polar solvent, where single indigo molecules are accommodated. This fact could account for both the narrower and more symmetrical band shape and the red shift observed in Maya blue. 3.2 MICRO-RAMAN SPECTROSCOPYSpectra recorded on Mesoamerican historic samples proved to be identical to the spectrum of modern Maya blue and, for the sake of clarity and brevity, will not be reproduced here. Inorganic compounds usually present in wall painting samples (such as calcium carbonate and gypsum) do not cause interference (as happens in infrared analysis) because their characteristic bands do not overlap with those of indigo. Moreover, the detrimental fluorescence due to the palygorskite matrix was avoided in this study by recording Raman spectra in SERDS mode, as explained in the experimental section. Good S/N ratios and excellent spectral quality were thus achieved. The Raman spectrum of the modern Maya blue, recorded in ordinary mode and in SERDS mode, is shown in figure 5. While the conventional spectrum is somewhat affected by the fluorescence of the palygorskite, the spectral features of Maya blue are still distinguishable. The spectra of crystalline synthetic indigo and modern Maya blue are compared in figure 6. It is interesting to note that, when focusing the laser beam on blue particles present in mixtures prepared by grinding indigo and palygorskite together, without heating, the spectrum recorded had the characteristic features of pure indigo. Unambiguous differentiation of pure indigo from its form fixed on palygorskite is easily achieved by examination of the spectra shown in figure 6. It can be seen that a band at 635 cm-1 disappears when going from pure indigo to Maya blue; likewise, a band at 1365 cm-1 decreases in intensity. At the lower wavenumber end of the spectrum, bands at 240, 253, 267, 276 cm-1 in crystalline indigo coalesce into a single broad band centered at 258 cm-1 in Maya blue. Toward the higher wave numbers, while two bands at 1571 and 1583 cm-1 are found in indigo, only a band
In general, the distribution of electronic charge in a molecule such as indigo shows high polarizability 3.3 FTIR MICROSPECTROSCOPYWhen removal of microscopic samples from the artifact is allowed, FTIR microspectroscopy is a valuable analytical tool for the identification of Maya blue. Using a diamond cell accessory, good-quality spectra can be obtained from particles as small as 50 μm in diameter. Improved spectral quality can be achieved by restricting the analytical window to pigment particles showing the more intense hue after compression in the diamond cell anvil. Infrared spectra distinctly showed specific bands due to the palygorskite and indigo constituents of the Maya blue pigment. A more in-depth analysis of the infrared spectral data for Maya blue is helpful not only to establish FTIR as a viable technique to identify the pigment but also to highlight changes in the carbonyl and amine absorption bands due to fixation on the clay. Indigo is a polyatomic molecule with 30 atoms and 84 vibration modes (Schweppe 1997): a complete assignment of the vibrational bands has been proposed in the literature (Tatsch and Schrader 1995). Spectra obtained on reference samples of palygorskite, modern Maya blue, and indigo are presented in figure 7 (curves a, b, and c, respectively). Some bands clearly attributable to the indigo molecule are visible in the Maya blue spectrum in the region between 1630 and 1250 cm-1, where interference due to the clay is minimal (for a detailed IR study of palygorskite, see Frost et al. 2001).
The strong dependence and high sensitivity of the C=O stretching band to formation and type of H-bond interactions are well known, with indigo being the most sensitive of members of the indigoids series (indigo, selenoindigo, and thioindigo) (Klessinger and L�ttke 1966). Although needing further interpretation, infrared spectral data seem to support the hypothesis (Chiari et al. 2003) that, when in the channels of palygorskite (7.3 � wide), the indigo molecule (4.8 � wide) is hydrogen-bonded to the clay hydroxyls only through its C=O groups, with the NH groups remaining free. The band relative to N-H bending of the indigo molecule disappears in Maya blue, while it is known (Colthup et al. 1975) that generally H-bonding leads to an increase in N-H bending frequencies, a broadening of the spectral band, and an increase in IR intensity. The disappearance of the bands at 1392 cm-1 in the IR spectrum and at 635 cm-1 in the Raman spectrum points to a variation in charge distribution for the N atom in Maya blue compared to crystalline indigo (where the hydrogen of the N-H group and the oxygen of the C=O group of a neighboring molecule form a hydrogen bond). Molecular orbital calculations performed on the basis of an extended Huckel molecular orbital approach (Mealli and Proserpio 1990) confirm this assertion by
|